Wednesday
03
April 2019


Method

This map provides an overview of those river valleys within which groundwater flooding might be experienced, to aid county-scale assessments of groundwater flood risk. During a groundwater flooding episode, groundwater flooding may occur outside of the mapped outlines, and will not necessarily occur within any location within the mapped outline.

Groundwater Flood Risk

Forecast likelihood of threshold exceedance within 5 days (%)

Page generated: 2019-04-03 17:59, Results last modified: 2019-04-03 17:08

Hydrographs

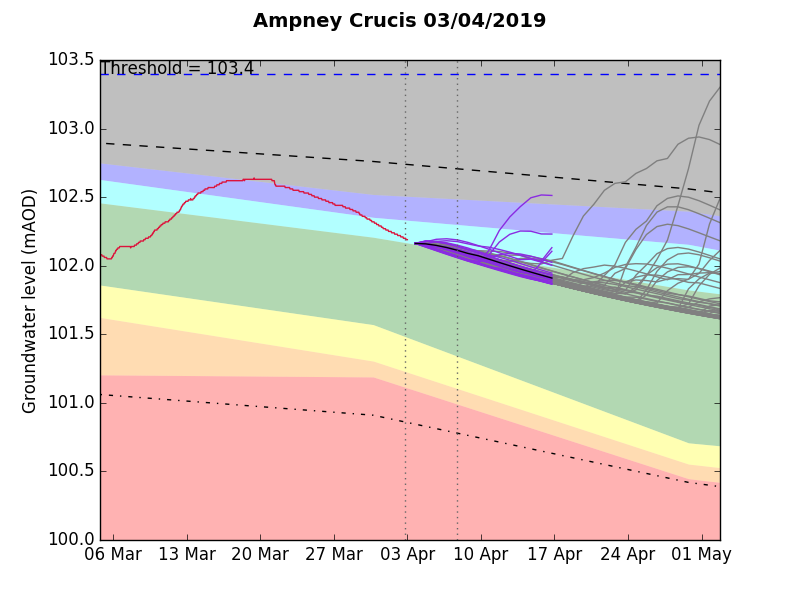
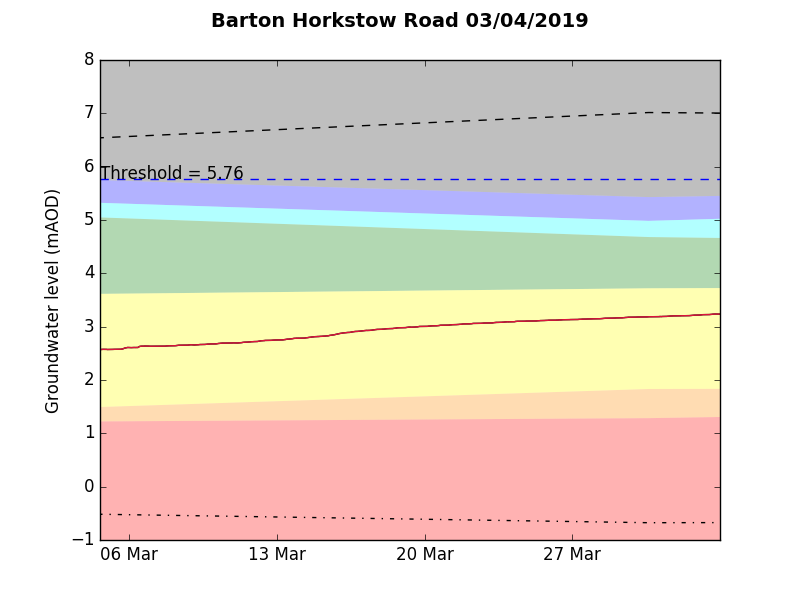
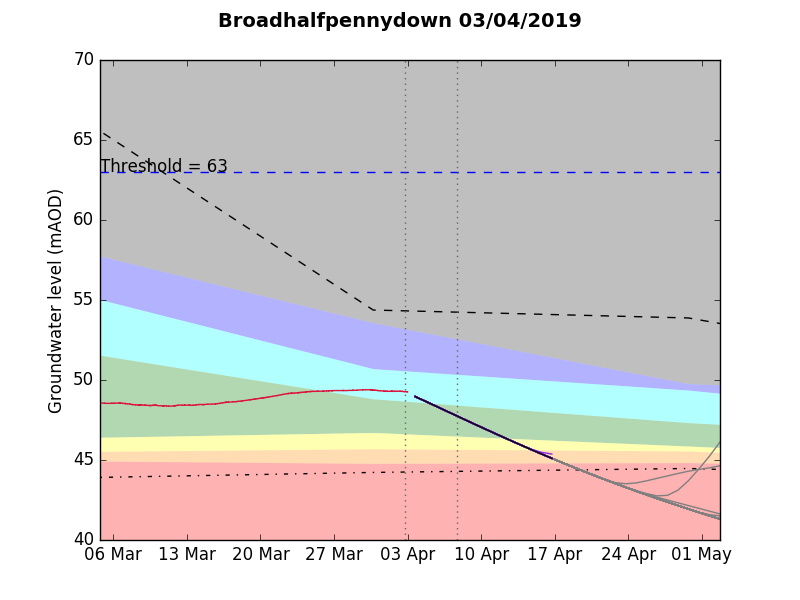
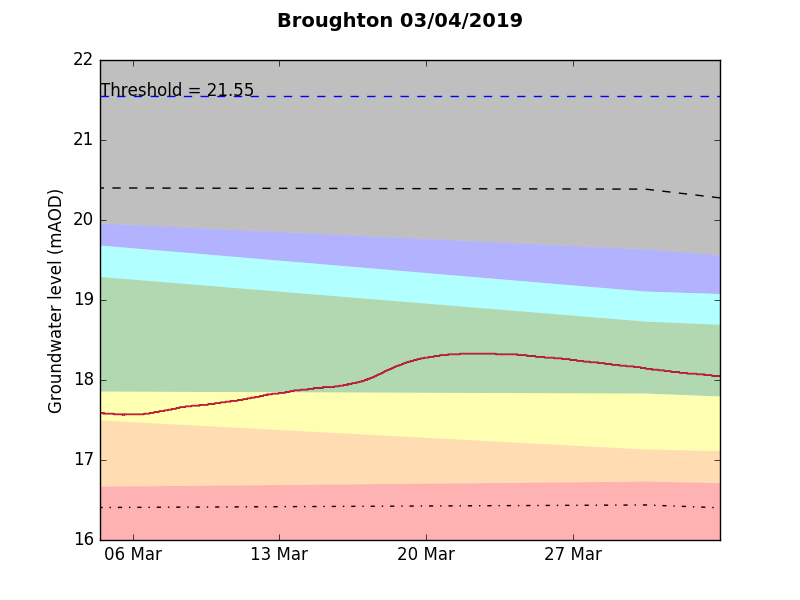
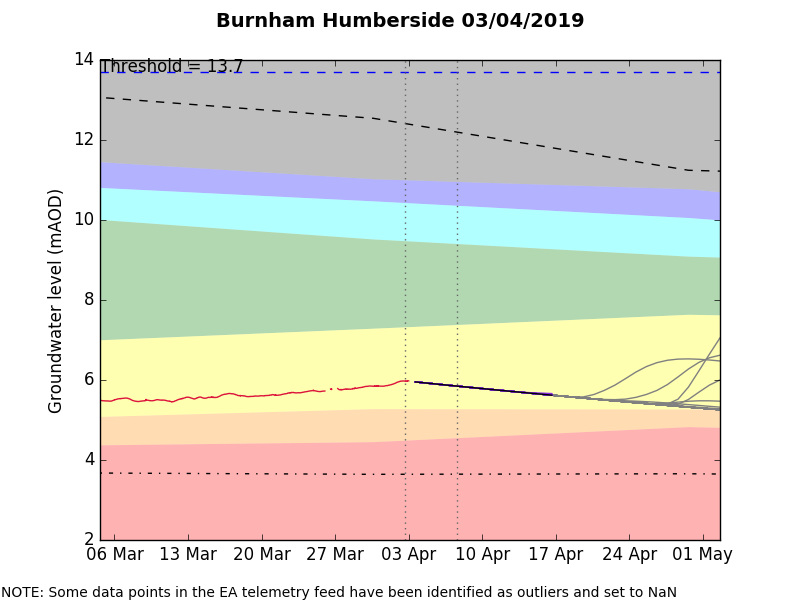
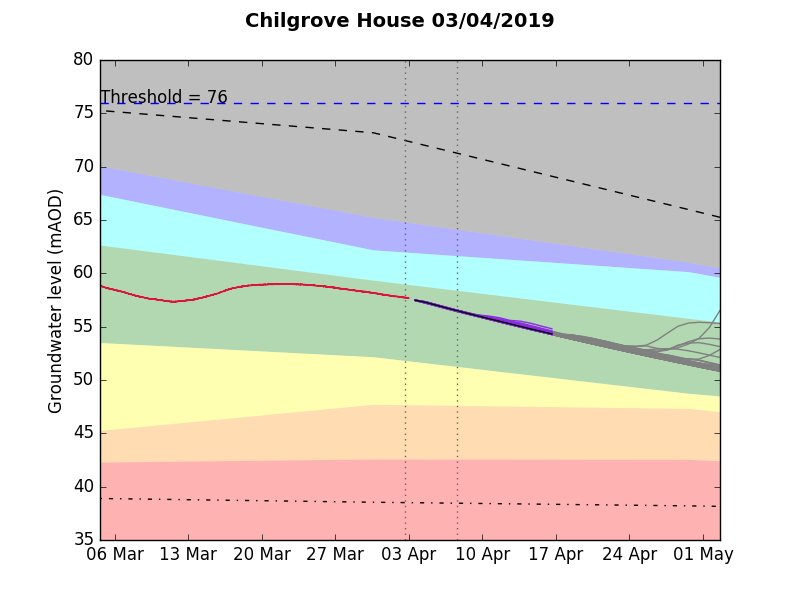
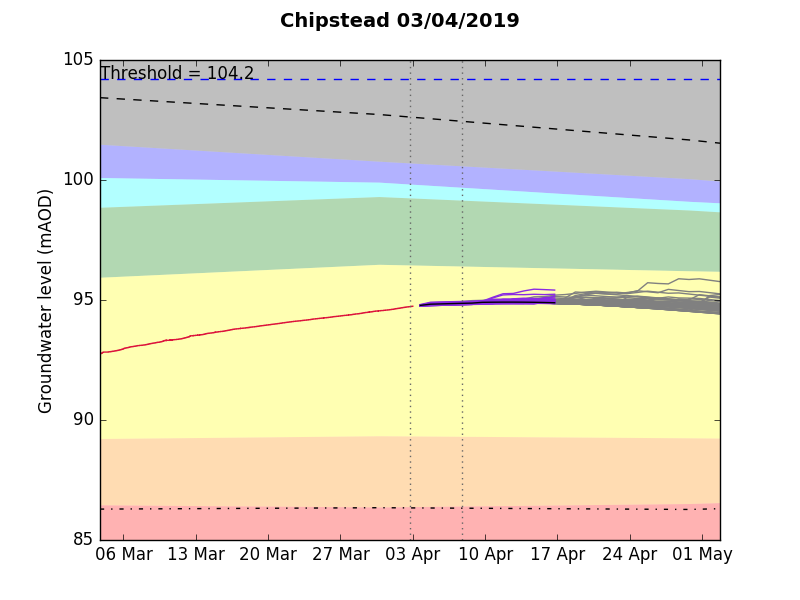
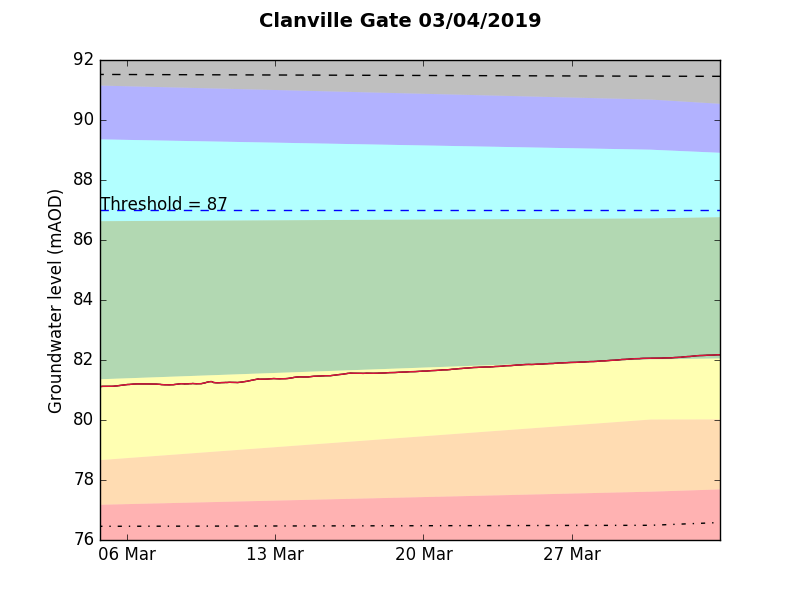
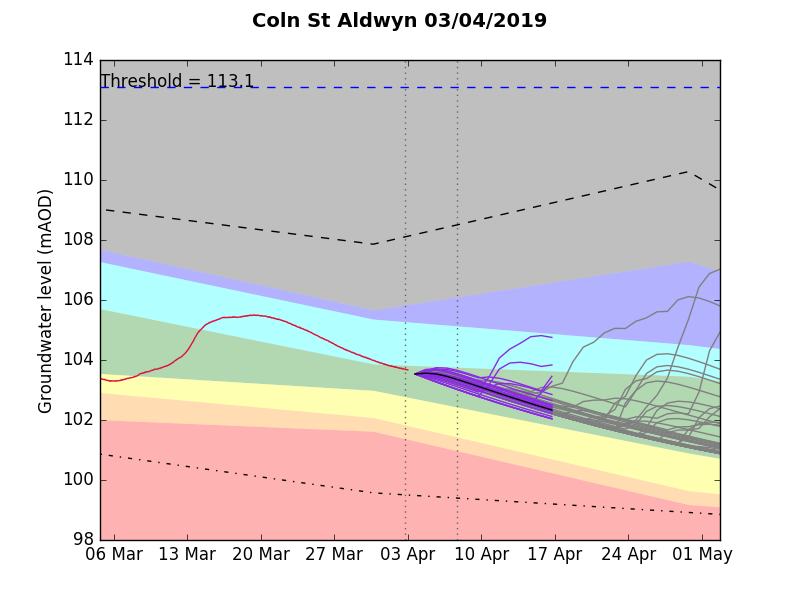
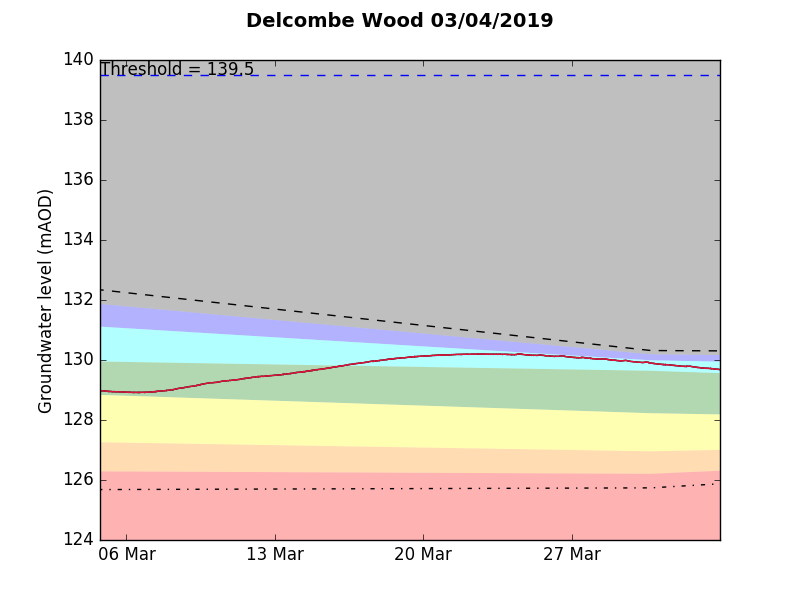
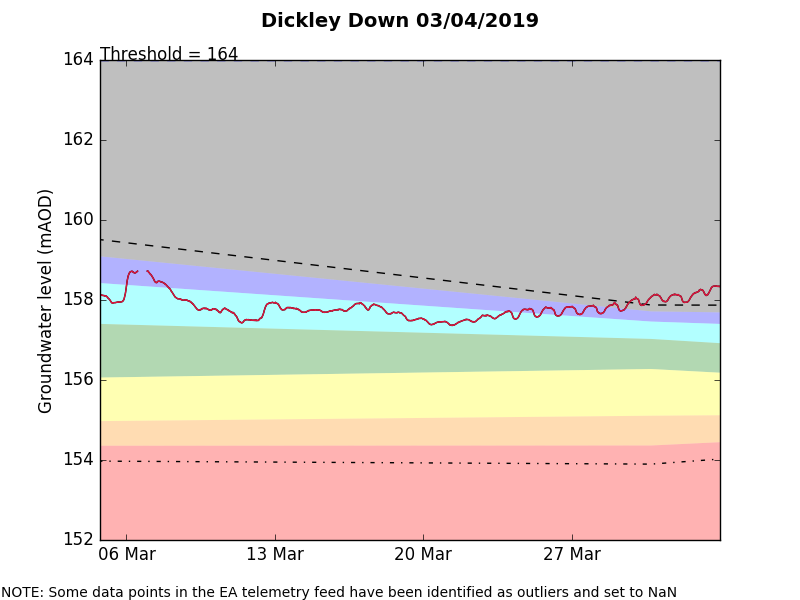
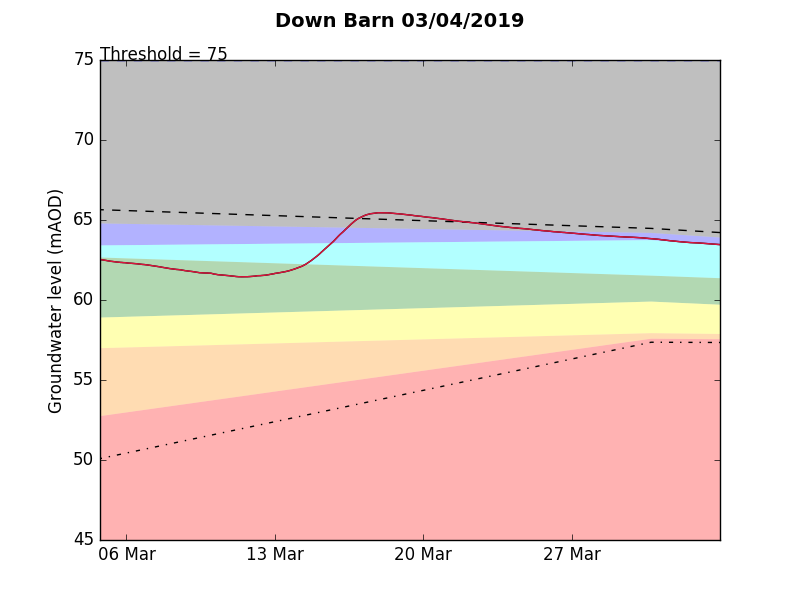
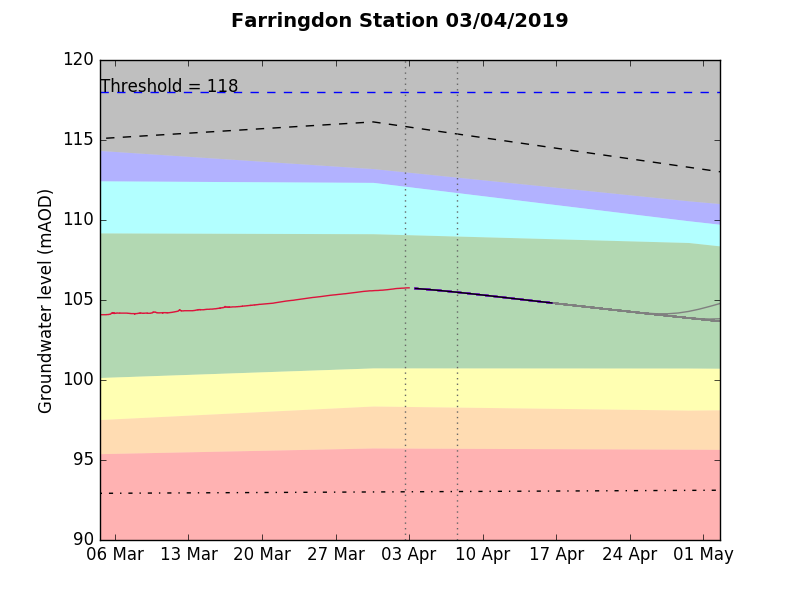
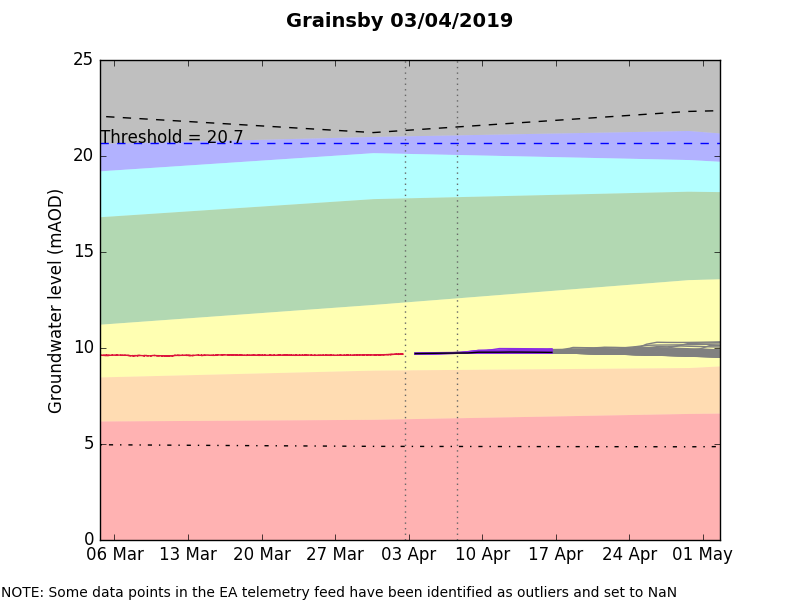
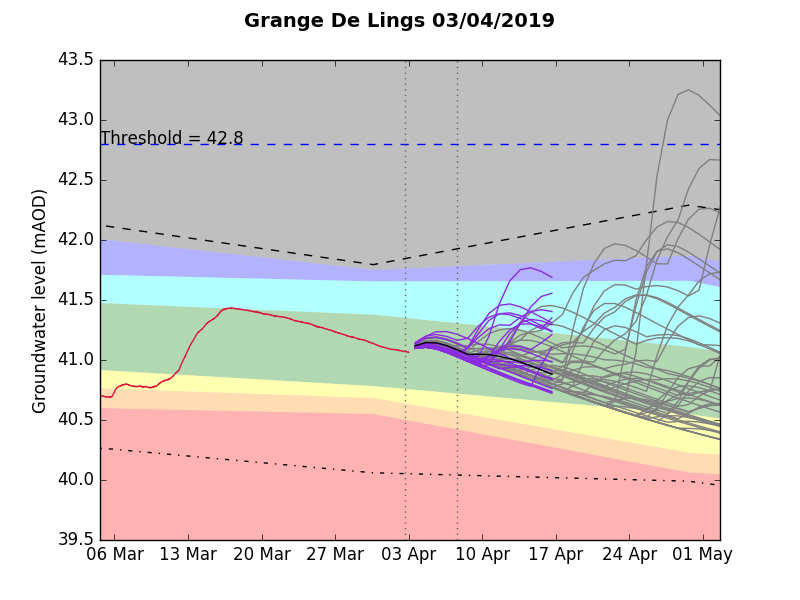
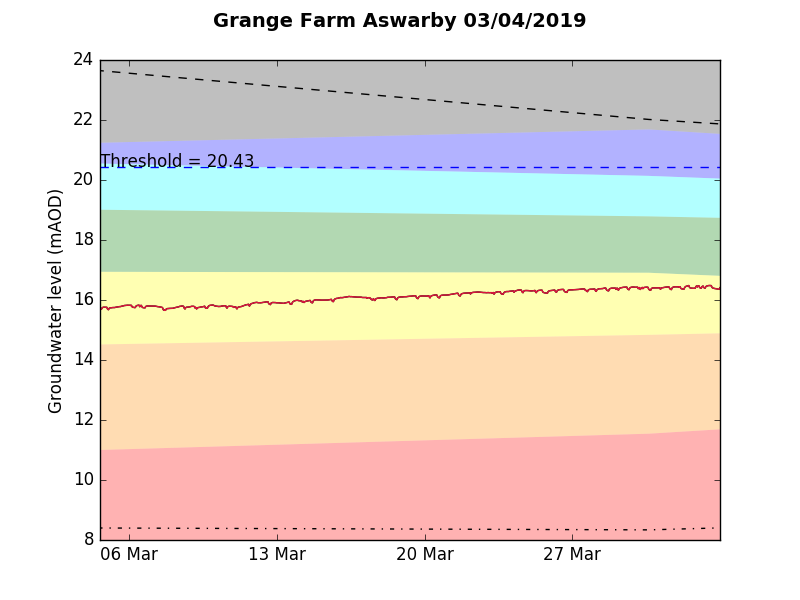
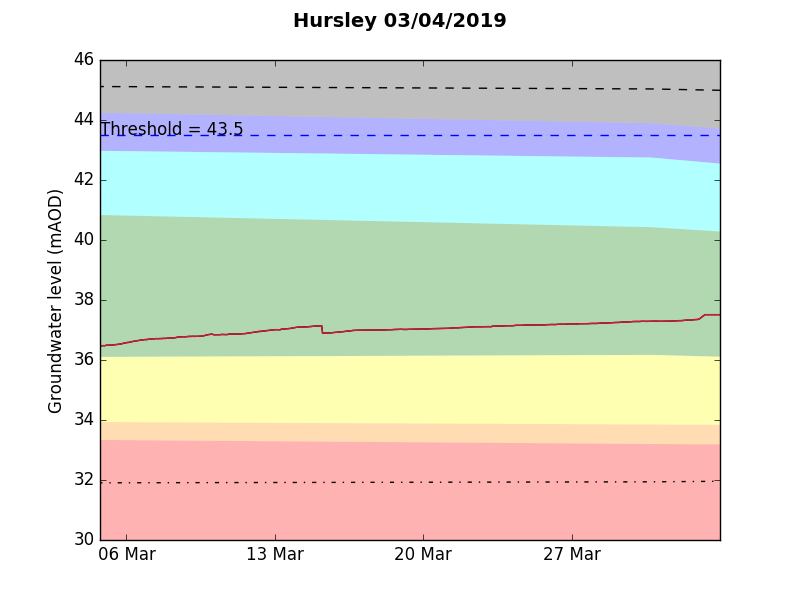
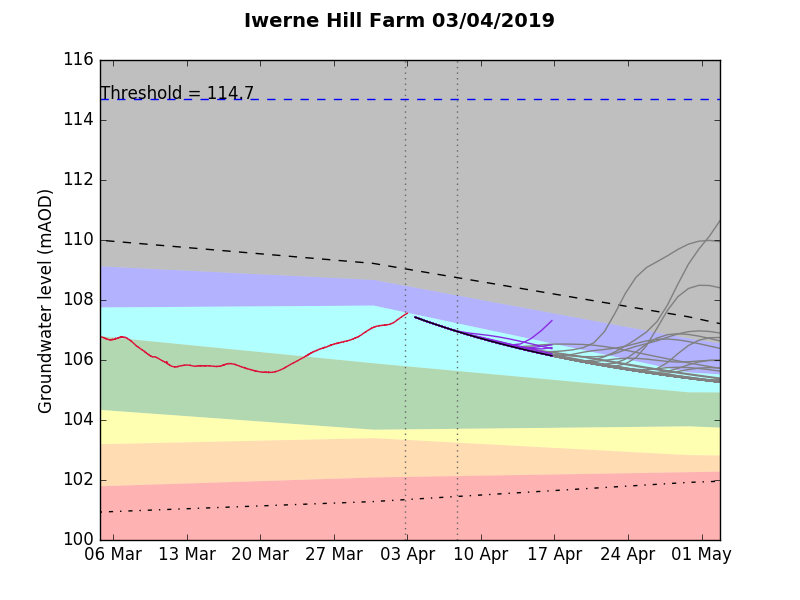
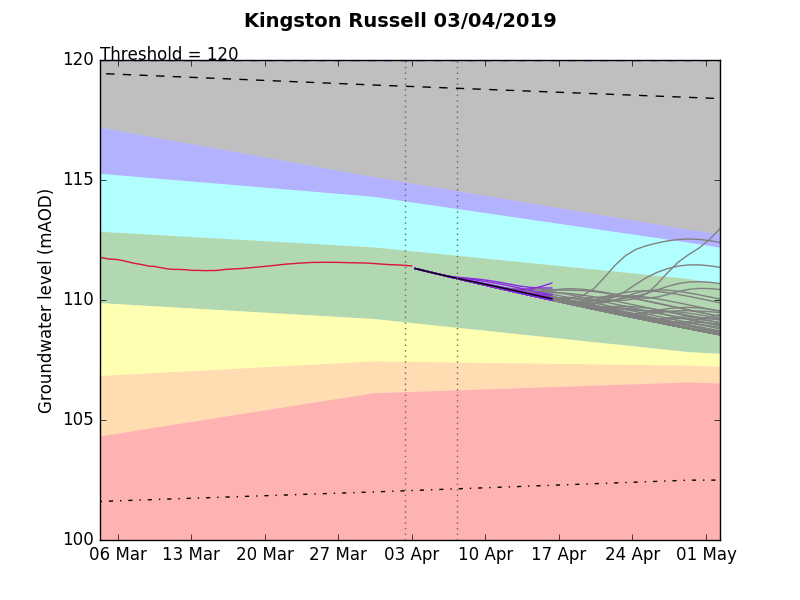
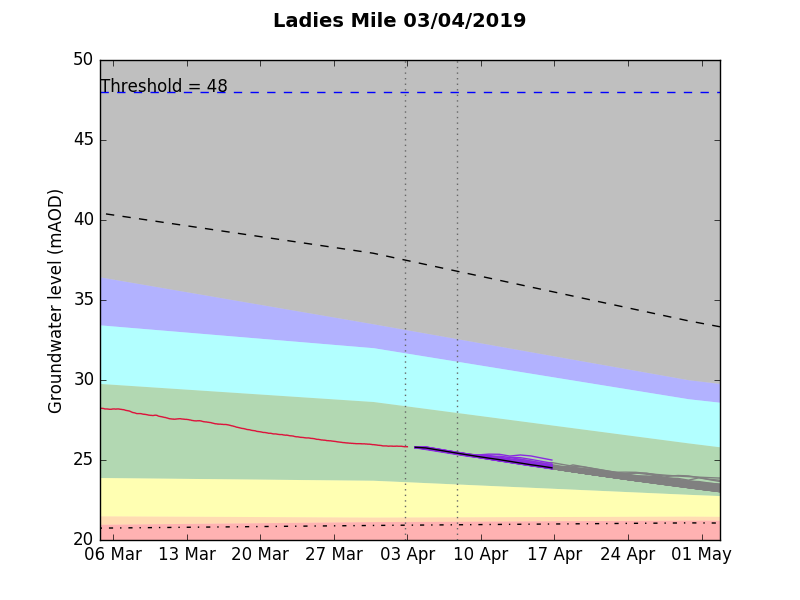
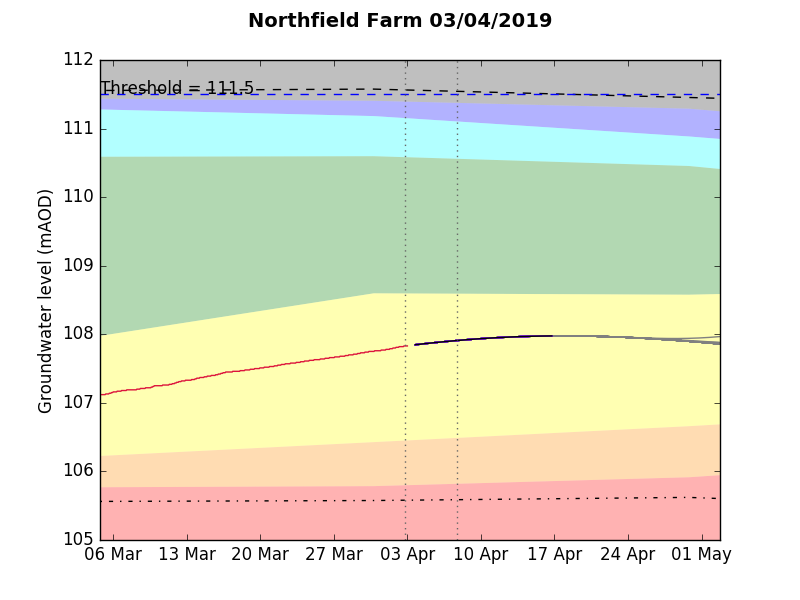
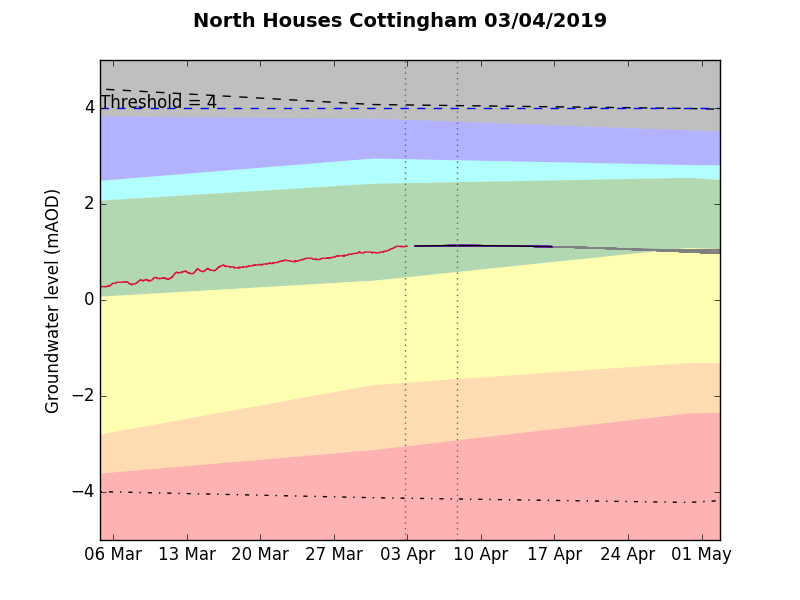
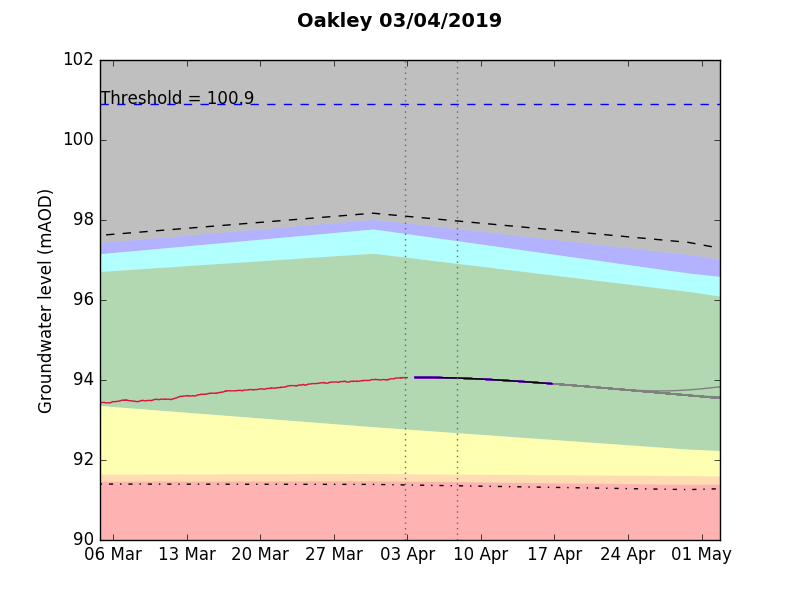
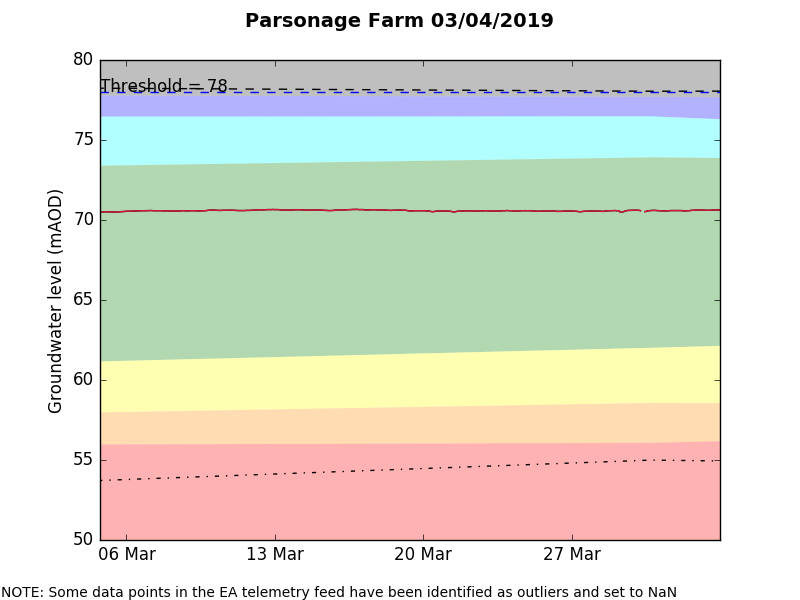
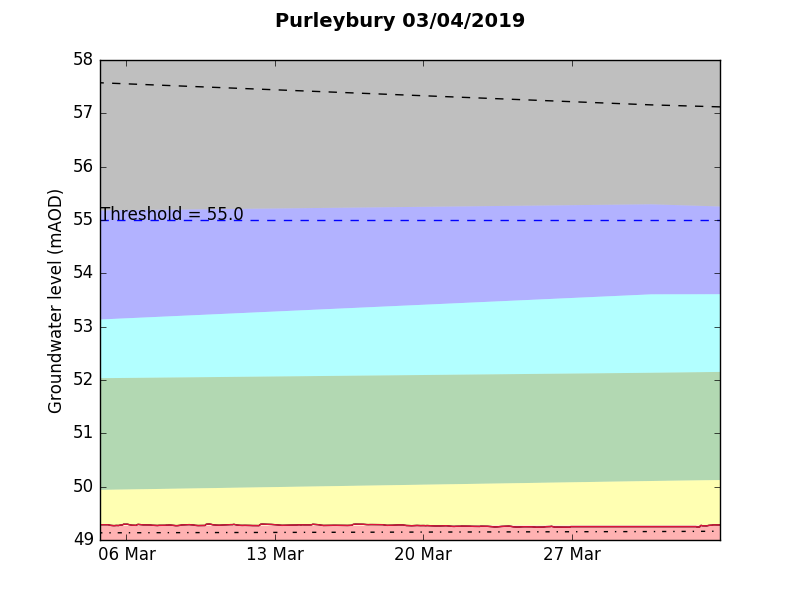
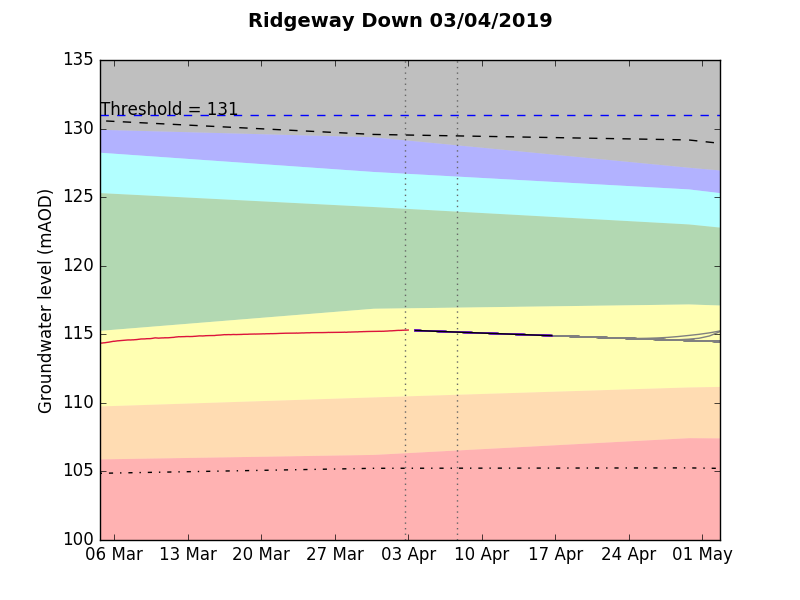
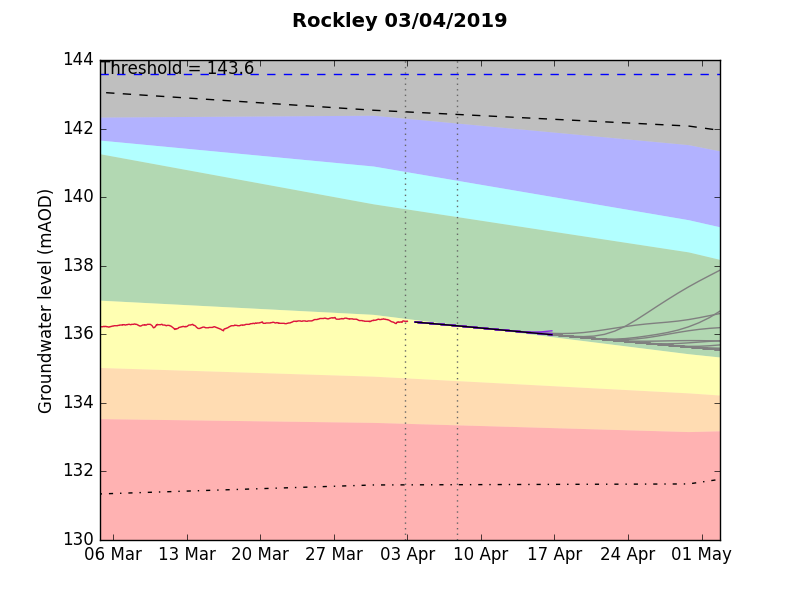
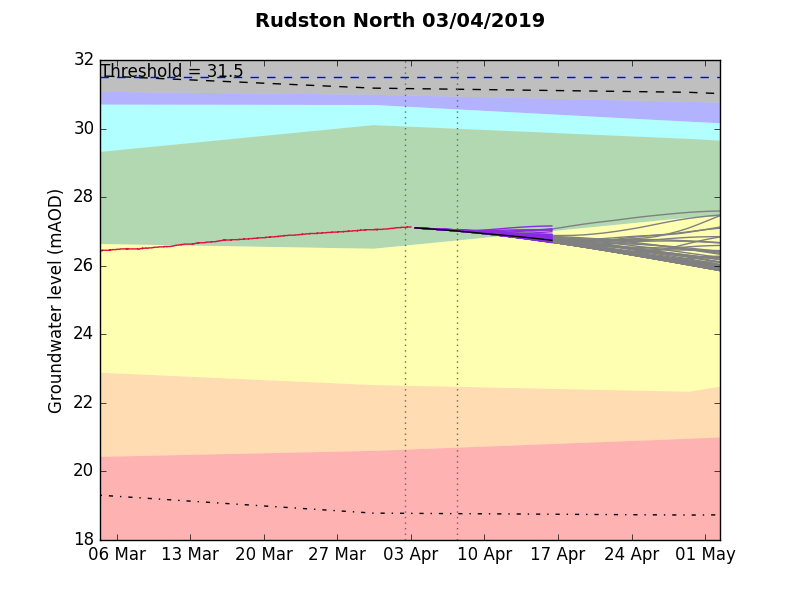
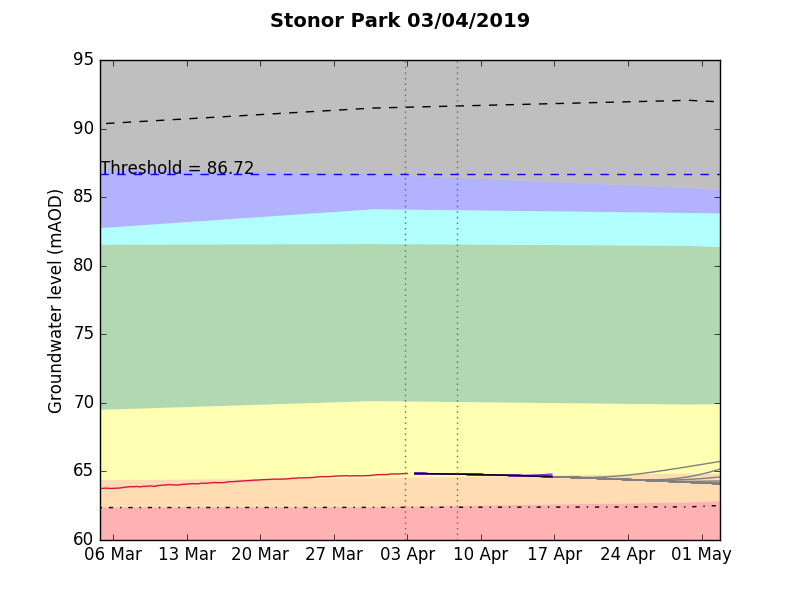
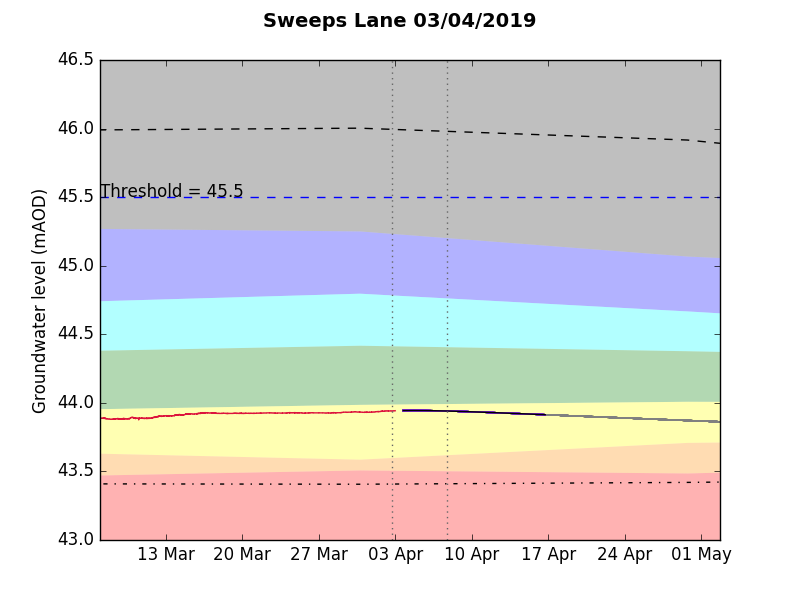
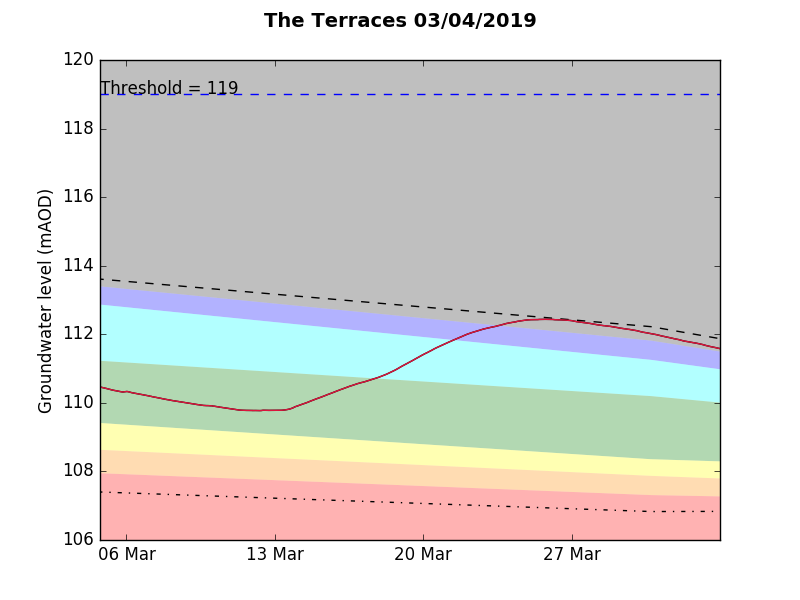
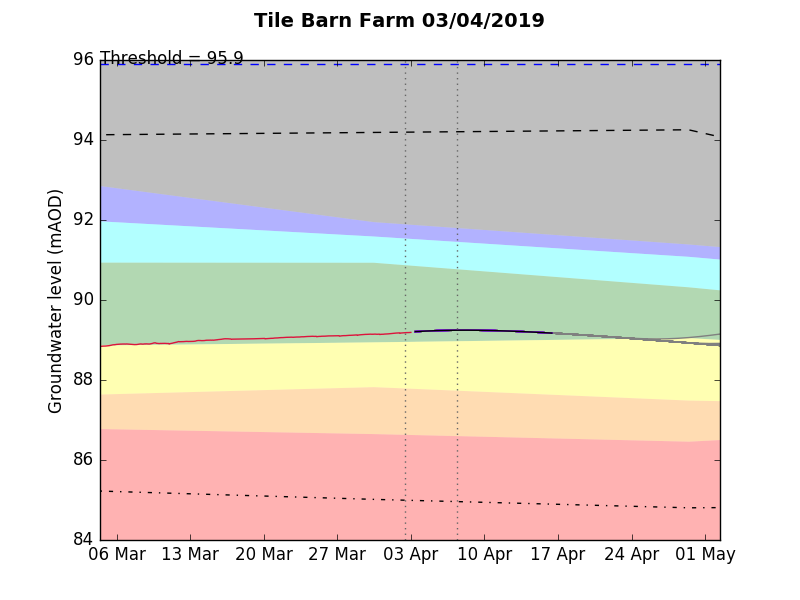
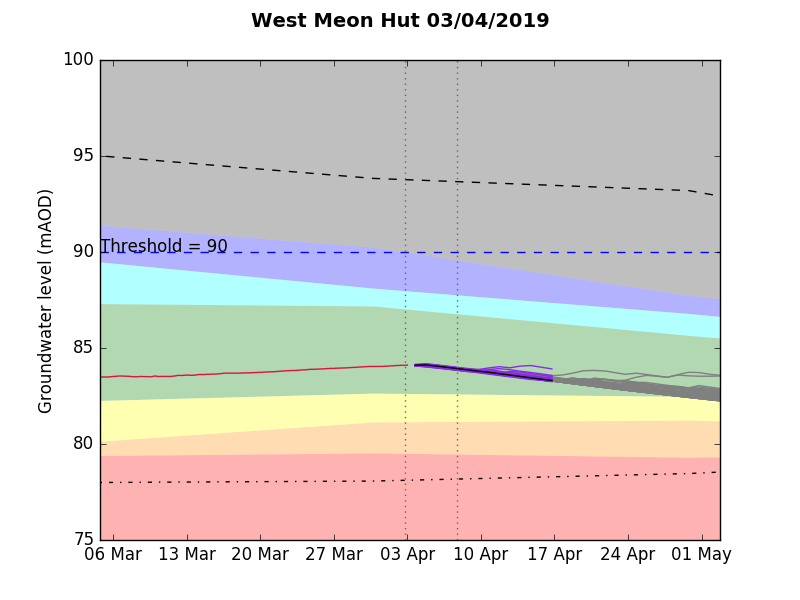
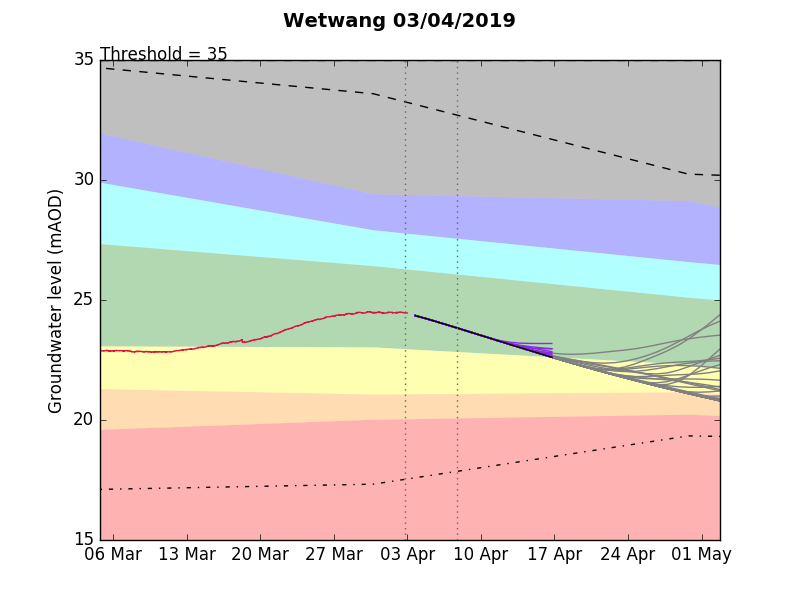
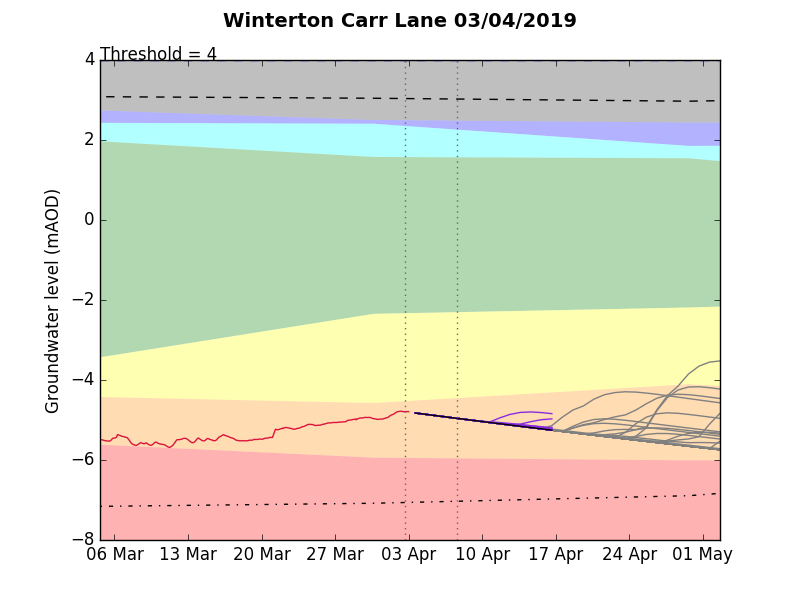
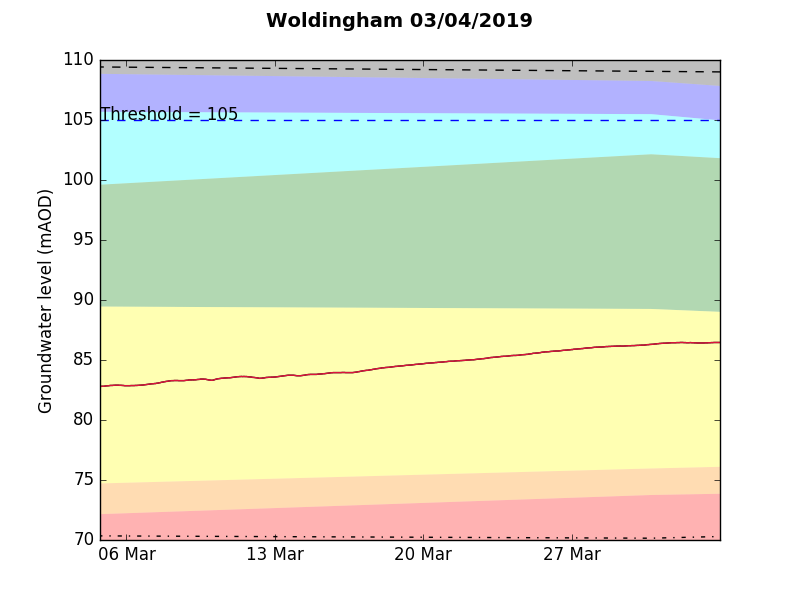
Long term statistical information on groundwater levels at each indicator borehole is displayed in the background of the figures below.

Ampney Crucis 2019-04-03.png
Barton Horkstow Road 2019-04-03.png
Broadhalfpennydown 2019-04-03.png
Broughton 2019-04-03.png
Burnham Humberside 2019-04-03.png
Chilgrove House 2019-04-03.png
Chipstead 2019-04-03.png
Clanville Gate 2019-04-03.png
Coln St Aldwyn 2019-04-03.png
Delcombe Wood 2019-04-03.png
Dickley Down 2019-04-03.png
Down Barn 2019-04-03.png
Farringdon Station 2019-04-03.png
Grainsby 2019-04-03.png
Grange De Lings 2019-04-03.png
Grange Farm Aswarby 2019-04-03.png
Hursley 2019-04-03.png
Iwerne Hill Farm 2019-04-03.png
Kingston Russell 2019-04-03.png
Ladies Mile 2019-04-03.png
Leasingham 2019-04-03.png
Lilley Bottom 2019-04-03.png
Little Bucket Farm 2019-04-03.png
North Dean House 2019-04-03.png
Northfield Farm 2019-04-03.png
North Houses Cottingham 2019-04-03.png
Oakley 2019-04-03.png
Parsonage Farm 2019-04-03.png
Purleybury 2019-04-03.png
Ridgeway Down 2019-04-03.png
Rockley 2019-04-03.png
Rudston North 2019-04-03.png
Stonor Park 2019-04-03.png
Sweeps Lane 2019-04-03.png
The Terraces 2019-04-03.png
Tile Barn Farm 2019-04-03.png
West Meon Hut 2019-04-03.png
Wetwang 2019-04-03.png
Winterton Carr Lane 2019-04-03.png
Woldingham 2019-04-03.png

Get in touch